November 2014
 I've been very fortunate to have the loan of a set of
Garmin Vector Power Pedals.
Reviewed by
DCrainmaker
I've been very fortunate to have the loan of a set of
Garmin Vector Power Pedals.
Reviewed by
DCrainmaker
My first ride yielded some very noisy data. So I decided to use a Turbo Trainer to take out the road bumps.
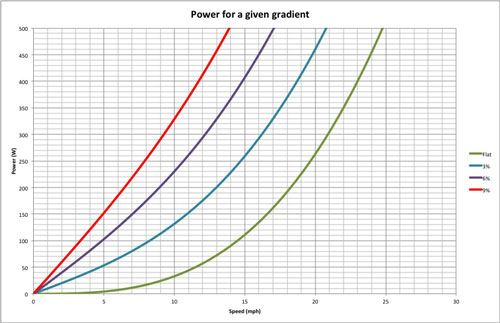
Then I started thinking about the theoretical power requirements and how my stationary trainer stacked up against these numbers.
What the graph on the right shows are the power requirements of the rider for various road gradients through the speed range.
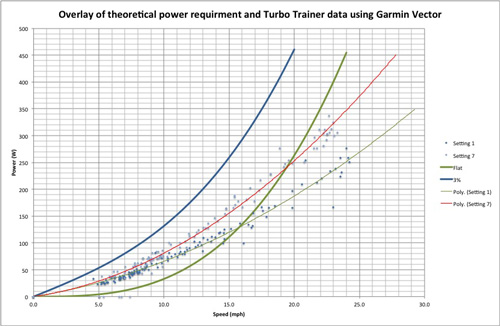 What this graph shows is the stationary trainer data at it's maximum and minimum resistance levels overlayed with the flat and 3% gradient theoretical power lines.
The fit of the Garmin data is a second order polynomial.
What this graph shows is the stationary trainer data at it's maximum and minimum resistance levels overlayed with the flat and 3% gradient theoretical power lines.
The fit of the Garmin data is a second order polynomial.
The raw data is stored in a .fit file which can be downloaded from the Edge head unit or exported using Garmin Connect then converted to a .csv fit using a Java routine called FitCSVTool.jar and details of this are available in the
FIT SDK User Guide.
There plenty of information about the
Power
required to pedal a bike on the web and also a nifty App available at
BikeCalculator which is also available on the Apple store.
This is all very good except it's clear that the stationary trainer whilst providing resistance doesnt mimic reality. It's resistance varies to the square law and reality is the cube law,
at least until gradient dominates over drag. Pity...
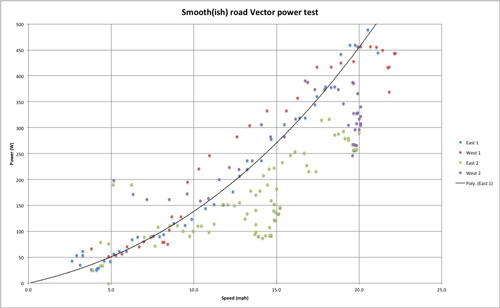 The final piece of the program was to find a nice smooth road (recently laid tarmac and minimal gradient) and gather some road data which should match the derived numbers.
I did two run to cancel out wind and road gradient. Not great data...
The final piece of the program was to find a nice smooth road (recently laid tarmac and minimal gradient) and gather some road data which should match the derived numbers.
I did two run to cancel out wind and road gradient. Not great data...
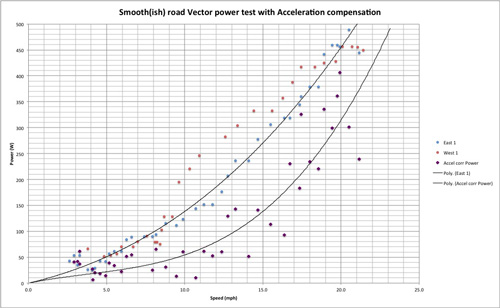 So I've extracted the best data and replotted it. First thoughts are that the power is way too high. Then I realised I needed to compensate for my acceleration during the run.
The compensation isn't brilliant but with data logged at only 1Hz what can you expect. At least it put the data into the right place. I've also taken the liberty to add a third order fit.
So I've extracted the best data and replotted it. First thoughts are that the power is way too high. Then I realised I needed to compensate for my acceleration during the run.
The compensation isn't brilliant but with data logged at only 1Hz what can you expect. At least it put the data into the right place. I've also taken the liberty to add a third order fit.
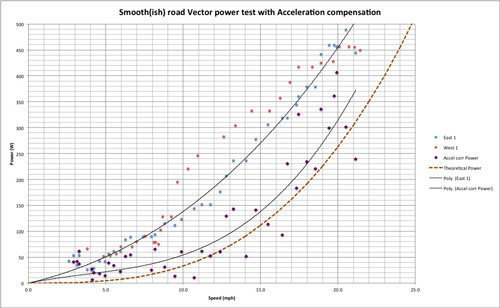 If I now overlay the theoretical power, the dashed brown line,it all looks a lot better.
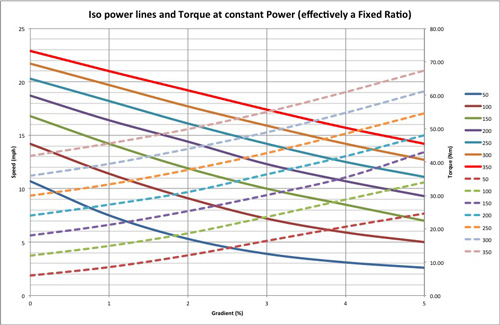 What this did prompt me to do was plot the Iso power and torque lines on speed and gradient axes. What this basically shows is that if you don't have much torque in your legs then you need a large ratio spread.
Back the the training...